How will Florida be affected by rising sea levels?
Created by
Eric J.S.
Posted
May 20, 2021
Last updated
July 15, 2021
Category
Analysis
Tools Used
ArcMapArcGIS ProArcGIS Online
Summary
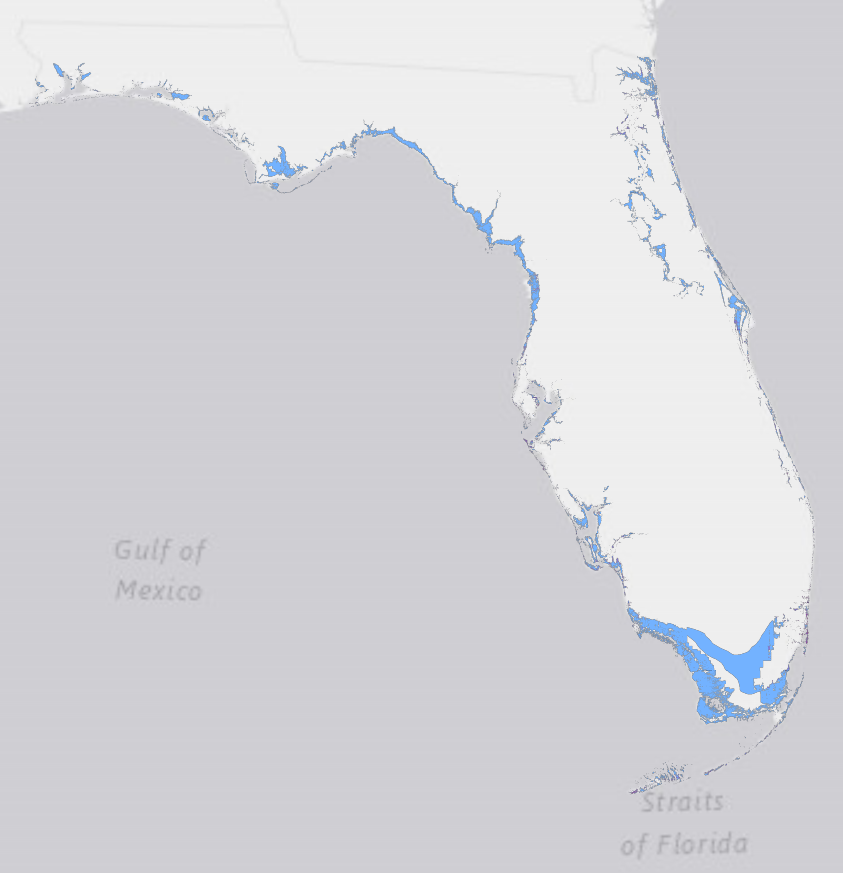
As sea levels rise, earth loses land area, especially in lower elevations near the coast. In the United States, the state of Florida sits only just above sea level with an average elevation of about 100 feet, second to Delaware at 60 feet, except that Florida has a much higher population. This puts Florida coastal residents at a high risk of losing their homes (albeit slowly) due to sea level rise.
What does the timeline look like for this slow disaster? What will Florida’s coastline look like in the future? How many people will be displaced? I will attempt to visualize these answers and provide insights into Florida’s geographic future. Specifically, I want to know how much land area Florida will lose and how many residents will be displaced by flooding in 100, 200, and 300 years from now.
Sea levels are rising incredibly slowly, and many coastal structures are already prepared for slight increases in water levels due to tides and storms. I imagine the majority of the flooding will be most destructive in the far future, 300 years and beyond. However, there are areas which are vulnerable right now, including wetlands, beaches, and roads. I expect the number of affected residents to increase exponentially with each hundred years.
Results
| Year | 2113 | 2213 | 2313 |
|---|---|---|---|
| Sea Level Rise (cm) | 33 | 66 | 99 |
| Area Underwater (km2) | 3,584.53 | 6,542.19 | 8,976.35 |
| Area Underwater (%) | 2.58% | 4.71% | 6.46% |
| Population Displaced | 90,720 | 239,976 | 512,149 |
| Population Displaced (%) | 0.48% | 1.28% | 2.72% |

Notes
- The DEM is from 2013, so that’s the starting year of my timeline.
- The average sea level rise is 3.3 millimeters per year according to NASA: https://climate.nasa.gov/vital-signs/sea-level/
- The Census data I used is from 2010, so all calculations are based on those numbers.
- Florida’s total population in 2010 was 18,801,310
- Florida’s total land area (not including water) in 2010 was 138,887 square kilometers.
Interpretation
Florida residents should not be worried about losing their homes to sea level rise. Although my data does show a significant number of people living in flooded areas in the future, that future is very distant. The purpose of this analysis was to illustrate the effect that sea level rise will have on coastlines over time.
Florida will lose land over time, especially in marshlands and beaches, but some of that land loss will be mitigated by marine construction (such as bulkheads) and land filling. I can say from my experience living in Delaware that any new properties constructed in the future will be filled and graded appropriately as well as being built higher off the ground to avoid flooding. Florida has plenty of time to avoid rising tides with proper infrastructure (to a degree).
Methods
My process generated 3 data sets, one for each time interval. The sea will be at 33 centimeters in 100 years, 66 centimeters in 200 years, and 99 centimeters in 300 years. For each time interval, I found the land area below sea level, filtered out areas not connected to the ocean, and merged appropriate population data with the remaining land area.
Data Preparation
Create a state boundary polygon by merging county boundaries. This polygon is a strict outline of the state of Florida and helped in limiting my calculations to the areas within the state. For example, the DEM I used included areas of Alabama, Louisiana, and Georgia, which were obviously unnecessary.
Create a coastline buffer polygon by buffering the coastline by 100 meters. I used this polygon to find landlocked areas below sea level so I could eliminate them from processing. The sea only approaches from the coastline, so if an area is below sea level, but is surrounded by higher ground, it will not be flooded by the sea.
Remove water from the DEM. A large portion of cells in the Florida DEM had values of -1. These were noted as water in the metadata, and were not useful for my processing, so I set them to Null.
Create a population density raster using Census Block Data. Census Blocks are the building blocks for all geographic boundaries for which the Census Bureau tabulates data, meaning they are the smallest areas for general Census data. To get smaller, equal areas, I calculated the population density of each Census Block and rasterized them to 100 meter cells.
Data Processing
Find DEM cells below sea level and set other raster cells to Null. I did this for each data set: cells less than 33 centimeters, less than 66 centimeters, and less than 99 centimeters. I resampled the 5 meter cells to 100 meter cells to reduce processing time and because such detail is not needed for analysis at the state level.
Convert the rasters to polygons. Polygons will be easier to process for the remaining steps.
Buffer the polygons by 10 meters and dissolve them to merge adjacent polygons and generalize the affected areas. Buffering and dissolving creates fewer large polygons versus many small polygons. This essentially connects any polygons that were barely touching.
Select polygons that intersect with the coastline buffer polygon and remove polygons that do not intersect with the coastline buffer. The sea only approaches from the coastline, so if an area is below sea level, but is surrounded by higher ground, it will not be flooded by the sea and is therefore not affected by sea level rise.
Get zonal statistics of population density. I attached the sum of the population density of each cell within each polygon to calculate the approximate population within each area.
Calculate and attach the area of each polygon in square kilometers for easier analysis.
Limitations and Challenges
Predicting the Future is Very Difficult
I initially tried to calculate the population displacement percentages as a portion of the projected population totals of those years (2113, 2213, and 2313). The problem is that humans are hard to predict (who knew?), and the furthest projection I found on Florida’s population was only to 2070. I could have made my own projections using a linear formula, but those numbers would have been untrustworthy.
Additionally, even if my population predictions were miraculously accurate, I would have no idea where residents would be located. In 300 years, the population density map might look completely different anyway.
So, my results are based on the situation where everyone in Florida in 2010 is frozen in place for 300 years. But, they still provide some insight as to how Florida’s geography might change in the coming years.
Inherent Data Flaws
Unless everyone replies to the Census (which they don’t), the Census Bureau makes estimates based on the data it is able to collect. This means that the population data I used is inherently flawed, but it is very close to accurate.
Coastlines are hard to measure. How do you measure where the beach meets the ocean? What counts as land in a marsh or swamp? Do you measure the coastline at high tide or low tide?
The DEM I used was compiled from multiple sources from different agencies and did not cover the entirety of Florida. The gaps were mostly in the unpopulated regions of the Everglades or presumably in military property. I doubt that these gaps had a significant effect on my results.
Introduced Data Flaws
With a 5 meter cell size, the DEM I was using was taking forever to process, so I resampled it to a lower resolution of 100 meters, which of course, introduced error. But, my analysis was at the state level so this error was acceptable.
Data Sources
All data was gathered from the Florida Geographic Data Library (FGDL) in May 2021. FGDL can be found online here: https://www.fgdl.org/metadataexplorer/explorer.jsp
- FLORIDA DIGITAL ELEVATION MODEL (DEM) MOSAIC - 5-METER CELL SIZE - ELEVATION UNITS CENTIMETERS
- Layer name: FLIDAR_MOSAIC_CM
- Date published: January 2013
- FLORIDA COUNTY BOUNDARIES - SEPTEMBER 2015
- Layer name: CNTBND_SEP15
- Date published: September 2015
- FLORIDA COASTLINE
- Layer name: COAST_FEB04
- Date published: February 2004
- 2010 U.S. CENSUS BLOCKS IN FLORIDA (WITH SELECTED FIELDS FROM 2010 REDISTRICTING SUMMARY FILE AND SUMMARY FILE 1)
- Layer name: CENBLK2010_AUG11
- Date published: August 2011