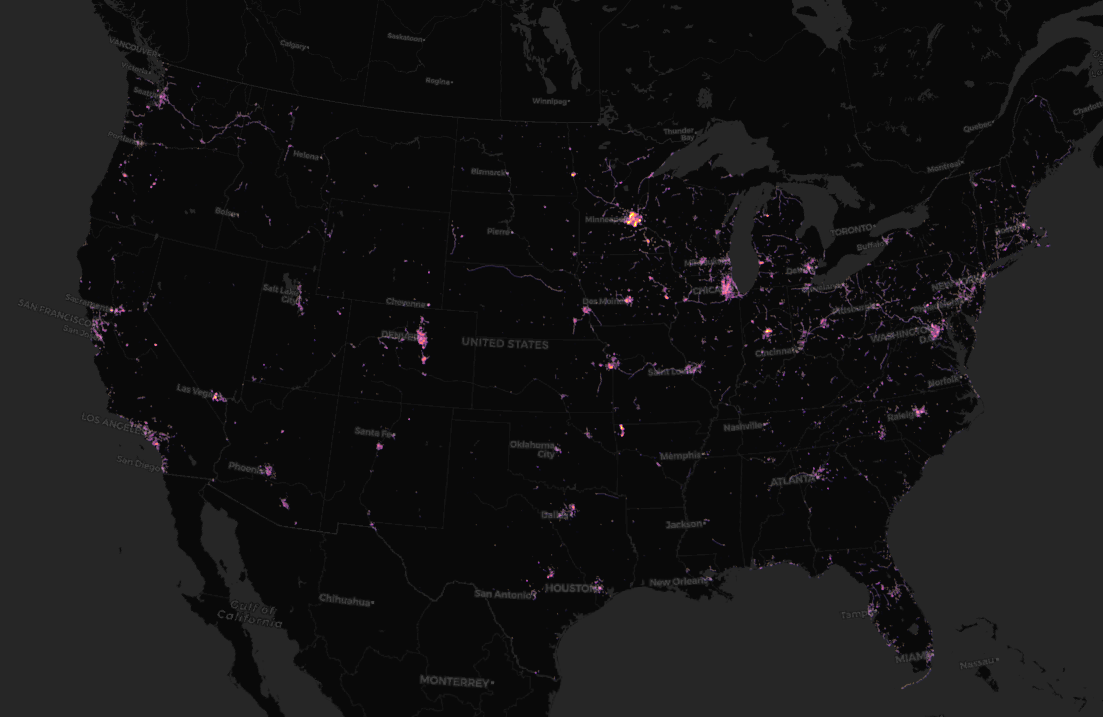
Where in the US has the most bike paths?
Created by
Eric J.S.
Posted
October 1, 2021
Last updated
June 14, 2022
Category
Analysis
Tools Used
QGISArcGIS ProArcGIS Online
Summary
I always prefer riding my road bike on a designated bike path. Any sort of separation from traffic offers a huge increase in safety and makes the ride much more peaceful. Where in the US has the most bike paths?
What defines a bike path?
OpenStreetMap distinguishes between cycle lanes and cycle tracks. A cycle lane lies within the roadway itself (on-road), whereas a cycle track is separate from the road (off-road). Tracks are typically separated from the road by e.g. curbs, parking lots, grass verges, trees, etc.
OpenStreetMap Wiki
These cycle tracks are the ones I’m interested in. They are tagged as “cycleways”.
Cycleways are not always exclusive to bike riders, they are typically paved paths shared with pedestrians.
Data Acquisition and Preparation
I used Osmosis to filter a snapshot of USA OSM data from September 2021, which is the same snapshot I used in my toll booths map. You can find the USA OSM snapshot here.
Osmosis is a command line tool for processing OpenStreetMap data. I had to use Osmosis because other tools I tried were not practical for scanning and filtering 7 gigabytes of data. I wrote a more detailed explanation in my U.S. Toll Booths report.
Here is the command I used to filter the cycleways:
osmosis ^
--read-pbf-fast "C:\path\to\pbf\us-0921.osm.pbf" ^
--log-progress ^
--tag-filter reject-relations ^
--tag-filter accept-ways highway=cycleway ^
--used-node ^
--write-pbf bikepaths.osm.pbf
In short, here is what this command does:
- Read the PBF file quickly
- Output every few seconds to show progress
- Ignore relations (areas)
- Return all ways that are tagged with “cycleway”
- Include all of the nodes associated with those ways
- Write (or overwrite) to “bikepaths.osm.pbf”
The carrots (^) simply allow the command to split multiple lines for readability.
To create the heat map layer, I used the Line Density geoprocessing tool in QGIS. This tool outputs an interpolated raster, which I was able to save as a GeoTIFF.
I did my analysis and created the PDF map in QGIS, but to create the web map I utilized ArcGIS Pro. All of my web maps are hosted by ESRI in ArcGIS Online, and ArcGIS Pro allows me to easily upload my layers for this purpose.